Introduction
Preparations are being made for commemoration in the year 2000 of five years of Pedro Álvares de Cabral arrival at the Brazilian coast near Porto Seguro. As an example of the exaggeration that surrounds this event Capistrano de Abreu the well known Brazilian historian who lived between 1853 and 1927 referred to the letter of Pero Vaz de Caminha who arrived here with Cabral and sent the news to Portugal’s king Manuel I as Brazil’s birth certificate.[1]
Although this could be news for Europe, what is now known as Brazil had been colorized thousands of years before 1500 by persons who Christopher Columbus named Indians because he was sure he was arriving in India, not in a continent unknown to his European contemporaries. This colonization was made by people of Asiatic origin who enter the continent through the Bering Strait about 30,000-40,000 years ago.[2, 3]
“The surrounding non-Indian dominant society is not immune to Indian influences which may be reflected in the acquisition of new customs, words, food, and genes.”
The estimates about the number of persons who were here in 1500, however, vary a great deal. Carneiro da Cunha [4] listed estimates that ranged from 1 to 8.5 million. Bethell [5] discussed these values and favored a number of 2.4 million. This seems to be at present the most reasonable estimate emphasizing the fact that the region had already a considerable number of inhabitants before the “discovery”.
The European, African, and Neo-Asiatic “invasions”
Population changes started to occur with varying degrees of speed in the following centuries. While the Indians experimented a process of marked demographic decline due to conflicts with non-Indians and diseases to which they were not adapted, this was compensated by a steady flow of persons from other ethnic groups. Table 1 lists the statistics obtained mostly from the migration division of the Labor Ministry for the European and recent Asiatic immigrations in front of disembarkation documents and other sources for the African influx.

Table 1. Main immigration to Brazil during different periods of time [26-29]
Trends in time are clearly visualized in Table 1. Thus, the peak of the African immigration took place before 1820 while the bulk of the European arrival occurred during the 1877-1930. Important Japanese and Chinese introductions happened in recent times (peak for the Japanese in 1931-1963, for the Chinese in 1964-1972). The relative contributions of all these groups up to 1972 were of 58% for Europeans, 40% for Africans, and 2% for Neo-Asiatics.
The question of which naturally arises is how much these people have contributed to the gene pool of present Brazilians. This problem has been considered by several scholars, and a recent analysis [6] indicated that the migrant contribution (as opposed to vegetative growth) to the formation of the present Brazilian population could be estimated as being 18%. That indicates that differential fertility and mortality is the key variable for the representativeness of national and ethnic groups to present their Brazilians. Inter mixtures is also of course important. The country’s 1996 population (157 million) was estimated as being composed of 55.2% European derived, 6.0% predominantly African derived, 38.2% admixed, 0.4% Neo-Asiatic, and 0.2% Indian individuals.[7] The contrast between the 280,000 Brazilians Indians leaving now [8] and the pre Colombian estimate of 2.4 million is striking. In principle, this would correspond to just 10% survival. But the actual situation is more complex, since a large proportion of the alleles present in the admixed persons (especially in the north and center West) are of Amerindian origin.
Contact and consequences
What happens when Indians and non-Indians establish contact? The situation can be analyzed through the concept of interethnic friction, developed by Cardoso de Oliveira some time ago.[9, 10, 11, 12] He argued that tribal societies maintained with the surrounding society (national or colonial) relationships of opposition which are easily demonstrable since the existence of one tends to navy the existence of the other. This creates a dialectical relationship, since the two groups have interdependent but diametrically opposed interests.
“Whenever two humans populations meet, they inevitably exchange cultural values and genes.”
The outcome differs, however, to the painting on the side of the contact. Cardoso de Oliveira and Castro Faria [10] created a classification based on polar categories distinguished by population density and rate of economic development. The critical regions and those with low densities and high rate of economic development since it is there where more relatively non-contacted group exists and the clash with an aggressive expansion front are generally inevitable.
Other important factor are those related to the integration potential.[11] Here Cardoso de Oliveira identified three levels, economic, social and political. In the first, the important factor is the degree of dependence/independence of the two groups in terms of resources for subsistence. At the social level, the question is whether engines and non-engines are capable of mobilizing their respective components and to the Orient them towards their respective ends. Finally, at the political level, the point to be considered is the means chosen by the group to attain its objectives. In this case, following Max Weber, he distinguished power (the probability of imposing his/her own will inside a given social relationship) and authority (the probability of finding obedience).
The consequences of the contact for Indians are manifold involving their population structure (with changes in mortality fertility and mobility patterns); nutrition (frequently with substitution of a varied for a somewhat restricted diet based on one or a few staple foods); new infectious agents; variation in their hygienic conditions due to increased sedentary habits; cultural changes (sometimes involving negative self images); and interethnic marriages.[13]
On the other side the surrounding non-Indian dominant society is not immune to Indian influences, which may be reflected in the acquisition of new customs, words, food, and genes. A factor that sometimes serves to increase the amount of gene flow is that since the Indians generally live in reservations, they have free access to land for cultivation. Neo-Brazilians without lands therefore many times marry Indian women and establish themselves in these reservations, in some cases even claiming a certain degree of Indian ancestry to guarantee land rights.
Quantitative estimates of interethnic admixture
In terms of biological or social history, sometimes it is important to establish the amount of interbreeding that occurred between two ethnic groups. The methods available to quantify eventual estimates have been aptly reviewed by Chakraborty.[18] They can be broadly classified into two categories: those based on a) gene frequencies, and b) phenotype prevalence. They then can be separated according to the statistics used estimation procedure or number of parental strains considered.
Independently of the method used, however, two assumptions are made that are not always met but the available data: a) that the information about ancestral populations is reliable; b) and that no systematic factors beside gene flow are acting on the systems considered.
It is not our objective to reviewing the tale all the methods presently available since this was done by other authors.[14, 15] Instead, we are going to concentrate in two of them that were employed by us to evaluate the amount of non-Indian inheritance present among a series of Brazilian Indian groups. The basic principles behind the two methods are different so that we should clearly indicate them at the beginning.
“Biological and cultural differences are important aspects of our life since the dawn of humanity and they should be preserved in a climate of mutual respect.”
Szathmary and Reed’s [16] Procedure relies on rare allows that can be assumed to be ethnic specific. Since they are rare, their distribution can be assumed to follow a Poisson distribution. The number of “foreign” markers is counted (x) and divided by the total number of genes examined (N) considered all loci that have such distinctive alleles. The frequency of the markers in the parental population is, taking into account by dividing the preliminary amount of admixture obtained by the mean parental gene frequency.
Chakraborty’s method [17] uses the gene identity coefficient [18] to approach the problem. This coefficient estimates the probability that two genes chosen at random (from one or more populations) are identical in nature. Assuming that a hybrid population (h) received m1, fraction of its genes from population 1 and (1-m1) fraction from population 2, the gene identity between population 1 and h, J1h, is composed of two parts: 1) when did gene in the hybrid population is from population 1 (that has probability m1), gene’s identity is J11; and 2) when it originates from population 2 (event that occurs with probability 1-m1) gin identity is J12. Therefore,
J1h = m1J11 + (1-m1)J12
This can be generalized to include several alleles, loci end populations.[19] The next step [17] was to extend the gene identity method by applying a least square solution to all possible relationships derived independently by equations of the form given above. Chakraborty [14] argues that the J11 statistics are more stable than individual allele frequencies for sampling fluctuations and are therefore less likely to be affected by rare alleles (which have higher coefficients of variation).
Amerindian genes in neo-Brazilians
A relatively large number of studies have been performed in predominantly European or African derived Brazilian populations.[21, 21] The amount of Amerindian ancestry in these groups varies widely, showing also distinct patterns in the different main regions of the country. The main influence occurs in the northern region. Santos and Guerreiro [20] considered 11 populations of the area, only formally using for the admixture estimates the maximum likelihood method of Krieger at al. [22] The average obtained for the region as a whole was 41% Indian, 12% African, and 47% European ancestries. Considering that the population of Amazonia consists of about 10 million persons they concluded that if all Indian genes were concentrated in unmixed individuals the Amerindian population of the region would be composed of 4 million persons about two times more than the pre Colombian estimate for the whole country! One of us [21] arrived at somewhat different figures due to the inclusion of four predominantly African derived and won predominantly Amerindian derived populations but the fundamental contribution of Brazilian Indians to the gene pool of our northern population is also clearly demonstrated in this other data set.
The picture changes when we move to the Northeast. The data available for this region are less numerous, but the six studies listed [21] point to a smaller Amerindian influence (average of certain percent engine 36% African, and 51% European ancestries).
Previous studies reviewed in [25] had not even considered the possible American influence in southeastern and southern populations. Recent results, however, indicate that this attitude may be wrong. Dornelles et al. [23] taking into account a considerable amount of information (2,706 European derived individuals from several regions of Brazil’s southernmost state Rio Grande do Sul) obtained an average of 11% Indian, 7% African, and 82% European ancestry for the state as a whole. The figures for Santa Catarina (n=226) are different (5% Indian, 5% African, 90% European) but also indicated a certain Amerindian influence. These estimates were obtained using Chakraborty’s method;[17] in the comparison of the figures of attained by this method and that proposed in [16] among the Indians (below) we always observed higher estimates of admixture with the former. Therefore, these results in southern populations should be confirmed using ethnic specific markers.
As far as African derived populations are concerned Bortolini et al. [28] found that in Porto Alegre and Ribeirão Preto situated respectively in Brazil’s South and Southeast while the DNA autosomal hyper variable and protein loci did not detect any Amerindian influence in Porto Alegre and the farmer only 5% Amerindian ancestry in Ribeirão Preto, the picture changed when uniparental genetic markers were considered. In Porto Alegre while an estimate of the possible paternal contribution also did not indicate any Amerindian parentage, that maternally inherited mitochondrial DNA suggested 7% to 14% of Indian genes. For Ribeirão Preto, the Amerindian contribution was found to be low (4%) are absent using the Y-chromosome locus, DYS19, but this contribution increased to 10% when the mtDNA results were considered. It is clear therefore that the history of admixture uncovered may be different when matrilineal or patrilineal lineages are involved.
Neo-Brazilian genes in Brazilian Indians
One of us (FMS) has been interested in the patterns of genetic distribution among Amerindians for more than four decades now. About 16 years ago, we decided to join efforts in the analysis of the data that were increasingly accumulating due to the studies of our group and those of others. In 1988, we published a global analysis based essentially on protein markers, [13] since DNA population studies were only starting to be performed at the time. Since then considerable new information was obtained regarding South American Indians in general, and Brazilian Indians in particular, which was duly recorded in our databank.
For some genetic evolutionary analysis, it is sometimes important to consider that as free of the influence of recent interethnic admixture as possible. Therefore, in the above-mentioned 1988 study [13] we estimated at mixture levels (using Szathmary and Reed’s [16] method) for 58 South American (17 Brazilian) Indian groups. The number of systems available at the time however was smaller (at the most 12) than those that we have at our disposal now; and despite the fact that in individual papers such levels had been estimated for some tribes, no recent global evaluation of Brazilian Indians in general existed. This prompted the present review.
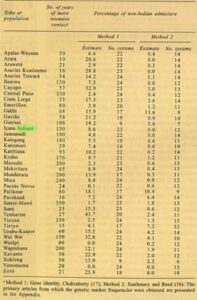
Table 2. Estimates of non-Indian admixture obtained by two different methods in 39 Brazilian Indian populations or tribes
Assert in our databank indicated the possibility of analysis in 39 Brazilian Indian populations or tribes. A list of them is given in Table 2. Based on a variable number of genetic systems (full list giving in Table 3) it was possible to calculate for all of them degrees of interesting admixture based on Chakraborty’s [17] and Szathmary and Reed’s [16] Methods. The 90 primary articles from which the genetic marker frequencies were obtained are listed in the appendix. In addition, based on the general information available to us, we tried to estimate the number of years of more intensive contact these groups had with non-Indians.
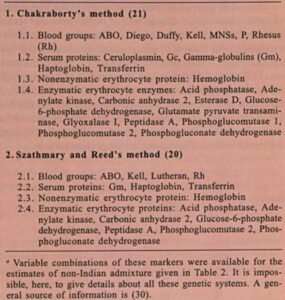
Table 3. List of the systems used to evaluate the amount of non-Indian ancestry present in 39 Brazilian Indian populations or tribes
The results of this effort are presented in Table 2. The first point to be emphasized is that while in somewhat more than 1/3 (36%) of the estimates the differences obtained with the two methods are less than 5% in almost half of them (44%) these differences are higher than 10%. Moreover, a) in the vast majority of the cases (34/39; 87%) the value of the administer is higher when Chakraborty’s method is employed; and b) Spearman’s rank correlation coefficient [25] yields a value of 0.21 only between the two methods. We tried to verify if these discrepancies were due to unusual values observed in certain genetic systems but could find no clear pattern, the differences not being due to any of them specifically. Moreover, many of the estimates obtained with Chakraborty’s method are clearly discrepant in relation to our fieldwork experience (for instance as much as 32.9% and 22.9% of non-Indian admixture among the Cayapo and Xavante, respectively). Also, while Spearman’s correlation coefficient between the estimates of years of contact and admixture obtain with Szathmary and Reed’s method yielded allows 0.06 value (Figure 1) this coefficient is negative (-0.25) using Chakraborty’s method estimates.
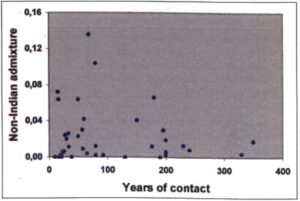
Figure 1. Relationship between the degree of non-Indian admixture estimated by Szathmary and Reed’s method [16] and the estimated number of years if contact in 39 Brazilian Indian populations
We therefore decided to adopt Szathmary and Reed’s method figures for further analysis. They were then plotted on Brazil’s map to evaluate eventual geographic patterns (Figure 2) and one was indeed discerned. As can be observed, higher admixture estimates occur at West. Spearman’s correlation coefficient controlling for latitude effects yelled it a highly significant (p = 0.000) value (-0.54) relating admixture with longitude West (Figure 3).
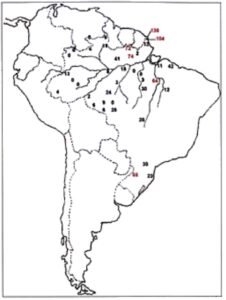
Figure 2. Degree of non-Indian admixture (x1000) estimated by Szathmary and Reed’s method [16] in 39 Brazilian Indian populations. Numbers in red indicate estimates above 5%.
It is clear therefore that the estimates will be detained for years of contact do not really represent the state of non-Indian influence that the populations and tribes considered are experiencing. But the West E trend found is indicative of the general Neo-Brazilian colonization movement that is therefore nicely identified.
Uniformity or pluralism?
Whenever two humans populations meet, they inevitably exchange cultural values and genes. The question that should be answered in terms of the future is what would be ideal for the Brazilian population as a whole: high uniformity or heterogeneity? Due to the peculiarities of our genetic material and the sexual reproduction process, it is highly unlikely that a pronounced degree of biological uniformity could be achieved in a country of continental size as Brazil. Moreover, it is not clear whether the present pattern of Indian reservations (which conditions are relative isolation of the Indians in relation to outsiders) will be maintained indefinitely. In the long run, the Indian communities themselves are those that should decide the degree of merging with the surrounding society that would be appropriate for them.
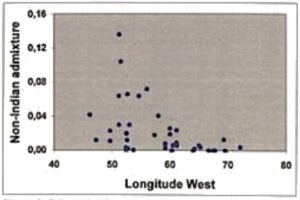
Figure 3. Relationship between the degree of non-Indian admixture estimated by Szathmary and Red’s [16] method and the geographical location (longitude) of 39 Brazilian Indian populations.
We live in a world in which now, provided the technical means are available, communication is instantaneous between any two points. The key expression here however is technical availability; power and wealth differences between individuals and nations are the true barriers to an effective one-world community. Let us hope that more social justice will decrease or eliminate these obstacles. This however does not mean that a dull repetition of some pattern should be sought. Biological and cultural differences are important aspects of our life since the dawn of humanity, and they should be preserved in a climate of mutual respect.


